Biomethane production costs typically range from €50–€110/MWh1, largely dependent on feedstock and technology, often competing with volatile natural gas prices, with 45 bcme of global potential cost-competitive with fossil natural gas. In the transport sector, advanced biomethane from waste is being produced for approximately USD 0.45–0.55/LGE.
Beyond quoting that
“Biomethane is the cheapest and easiest to scale form of renewable gas available today1“
, there are so many variables, and natural gas prices are currently (Q2 2026) so volatile that a blanket statement on the price of biomethane versus natural gas is an open question we have been unable to answer.
The Story in Brief:
- Biomethane production costs range widely — from USD 10/GJ to USD 30/GJ, with the cheapest supplies concentrated in Asia, where 40 billion cubic meters equivalent (bcme) is available below USD 10/GJ.
- Europe dominates the global market, holding 61.34% of market share in 2025 and generating USD 4.26 billion in revenue — a position driven by aggressive policy frameworks and renewable gas mandates.
- The global biomethane market is projected to grow from USD 6.95 billion in 2025 to USD 10.74 billion by 2034 at a CAGR of 4.97%, making it one of the most consistently expanding segments in renewable energy.
- Natural gas price volatility in 2022–2023 directly reshaped how biomethane is priced and valued, creating both risk and opportunity for investors and project developers.
- Guarantees of Origin (GoO) and Proof of Sustainability (PoS) certificates add a second pricing layer on top of the molecule price — understanding both is critical for accurate deal valuation and long-term forecasting.
Biomethane Prices Are Moving Fast — Here's What You Need to Know
The biomethane market in 2023 was not a slow-moving energy story — it was a market being actively repriced by policy shifts, gas market turbulence, and a surge of institutional capital chasing renewable gas assets across Europe and beyond.
For those considering investing in biomethane, financing a biomethane project, or developing a biomethane strategy, it's important to understand that the price of biomethane is not the whole story. Biomethane pricing operates on several levels – the actual molecule, the renewable certificate, and the sustainability credential – and each of these moved in different directions through 2023. Understanding how these layers interact is what sets informed market participants apart from those who simply react to headlines.
In this article, we'll take a deep dive into the factors that influenced biomethane prices in 2023, where the market stands currently, and what the data predicts for the future through 2034.
Understanding Biomethane and Its Importance to Investors
A quick look at Biomethane: Biomethane is a renewable gas that is produced by upgrading biogas. Biogas is generated through the anaerobic digestion of organic waste, agricultural residues, or energy crops. Once it is upgraded, it can be injected directly into the gas grid, used as a transport fuel, or supplied to industrial end-users. This makes it one of the most versatile renewable energy carriers available today.
Prices are important to investors for a simple reason: biomethane projects are long-duration infrastructure assets. A production facility that is built today may operate for 20 years or more. The revenue that this facility generates depends heavily on the price it can secure for its output. This includes both the gas molecule and the associated certificates. If you get the price assumption wrong in your model, the entire investment case changes. For more on the production process, you can explore biogas production from sewage sludge.
Unlike solar or wind, where the primary revenue driver is a feed-in tariff or power purchase agreement tied to electricity, biomethane revenue stacks multiple income streams. This complexity is a feature — it creates more ways to optimize returns — but it also requires a more sophisticated approach to price analysis.
“Cost Model for Biogas and Biomethane …” from www.mdpi.com and used with no modifications.
Comparing Biomethane and Natural Gas
While biomethane and natural gas are molecularly the same and both are primarily composed of methane (CH₄), their origins are what set them apart. Natural gas is a fossil fuel that is mined from underground reserves. Biomethane, on the other hand, is derived from biological sources, which makes it a renewable resource. Most regulatory frameworks even consider it to be carbon-neutral or carbon-negative, especially when you take into account the methane emissions that are avoided when waste decomposes.
| Attribute | Natural Gas | Biomethane |
|---|---|---|
| Chemical composition | Mainly CH₄ | Mainly CH₄ (identical) |
| Source | Fossil (underground reserves) | Renewable (organic waste, crops) |
| Carbon status | Carbon-emitting | Carbon-neutral to carbon-negative |
| Price drivers | Geopolitics, supply/demand | Policy, feedstock, certificate markets |
| Grid compatibility | Yes | Yes (after upgrading) |
| Tradeable certificates | No | Yes (GoO, PoS, RGGO) |
This difference leads to a price premium for biomethane over traditional natural gas. Buyers — particularly industrial companies with decarbonization commitments and transport fuel operators under blending mandates — are willing to pay above wholesale gas prices to secure renewable gas with verified sustainability credentials.
The Complexity of Biomethane Pricing Compared to Traditional Gas Markets
The pricing mechanism for natural gas is relatively simple: wholesale hub prices (TTF in Europe, Henry Hub in the US) are determined by supply and demand, with regional basis differentials added. However, this is not the case for biomethane.
When a biomethane producer sells to the European market, they are essentially selling three things at once: the gas molecule, which is priced near (but usually above) the wholesale natural gas benchmark; the Guarantee of Origin (GoO) or Renewable Gas Guarantee of Origin (RGGO) certificate, which certifies that the gas is from a renewable source; and a Proof of Sustainability (PoS) document, which confirms that the gas meets sustainability criteria under the EU's Renewable Energy Directive (RED II/RED III).
- Molecule price — tied to wholesale natural gas markets but with a renewable premium
- GoO / RGGO certificate price — traded separately, driven by corporate demand for verified renewable gas
- Proof of Sustainability (PoS) — required for compliance in transport fuel and industrial applications under EU RED directives
- Feedstock-specific premiums — waste-based biomethane commands higher certificate values than crop-based production under EU sustainability rules
The Role of Guarantees of Origin (GoO) and Proof of Sustainability (PoS) in Pricing
- GoO certificates are issued per megawatt-hour (MWh) of biomethane injected into the grid and can be traded independently of the physical gas
- PoS documents verify sustainability compliance and are required for biomethane to count toward renewable energy targets in transport and industry
- Certificate prices fluctuate based on regulatory demand signals, compliance obligations, and the availability of certified volumes in the market
- Waste-based biomethane (from manure, food waste, sewage sludge) commands significantly higher certificate premiums than energy crop-based production
The separation of molecule and certificate markets is what makes biomethane price forecasting a specialist discipline. In periods when natural gas prices fall, certificate premiums can partially offset the revenue impact — but only if a producer has correctly structured their offtake agreements to capture both income streams independently.
Investors and developers have found that independent scenario-based price forecasting is a crucial tool. This is due to the complex pricing structure, which includes the price of molecules, GoO/RGGO certificates, and PoS documents across various European markets and production types.

“natural gas …” from www.researchgate.net and used with no modifications.
Projected Biomethane Price Trends for 2023 and 2024
The biomethane market in 2023 operated in the context of stabilizing European energy prices after the unprecedented volatility of 2021-2022. During this period, Russia's invasion of Ukraine caused TTF natural gas prices to skyrocket to record highs of over €300/MWh. As wholesale gas prices decreased throughout 2023, the biomethane industry had to adjust. However, the situation was much more complex than a mere drop in prices.
In 2023, biomethane held a significant price advantage over fossil gas. This was due to a number of factors, including corporate demand for sustainability, stricter EU renewable energy requirements under RED III, and a growing number of long-term Biomethane Purchase Agreements (BPAs) that protected producers from fluctuations in the spot market. Despite a drop in molecule prices in line with TTF, the certificate market, especially for biomethane derived from waste, remained strong.
- The cost of TTF natural gas decreased from highs of over €300/MWh in August 2022 to between €40 and €60/MWh for much of 2023
- Although biomethane molecule prices followed TTF's general trend, they maintained a premium for renewable energy, especially for volumes injected into the grid
- GoO and RGGO certificate prices for waste-based biomethane remained high as corporate buyers competed for a limited number of certified volumes
- The cost of producing most European biomethane projects stayed between €60 and €120/MWh, depending on the feedstock and technology used
- Long-term BPAs signed in 2023 increasingly incorporated price indexation mechanisms tied to both TTF and certificate market benchmarks
Overall, the market saw a decrease in spot revenue but the value of long-term contracts remained attractive. This rewarded developers who had structured their commercial arrangements correctly entering the year. For more insights, you can explore the biomethane market analysis provided by Fortune Business Insights.
The Impact of European Energy Prices on Biomethane Costs
When European gas prices normalised post-crisis in 2023, it had a two-fold impact on the biomethane industry. Falling TTF prices squeezed the molecule component of biomethane revenues on the revenue side. However, the cost side saw a decrease in operating costs for energy-intensive production processes, particularly the upgrading step that purifies raw biogas to biomethane quality, as electricity prices fell across European markets.
However, the cost of feedstock was a different matter. The inflation of agricultural commodity prices, which continued into 2023, kept the input costs for energy crop-based production high. Producers based on waste and operating on tipping fee models were better protected, with gate fees from municipalities and food processors providing a negative feedstock cost that partially offset the revenue challenges from lower gas prices.
Key cost dynamic in 2023: Producers using municipal organic waste or animal manure as feedstock benefited from negative feedstock costs (tipping fees paid by waste generators), making their production economics more resilient than energy crop-based facilities when molecule prices declined.
As a result, the gap between the economics of waste-based and crop-based biomethane production widened — a structural shift that is changing project development pipelines across Europe and influencing which feedstock types attract institutional capital.
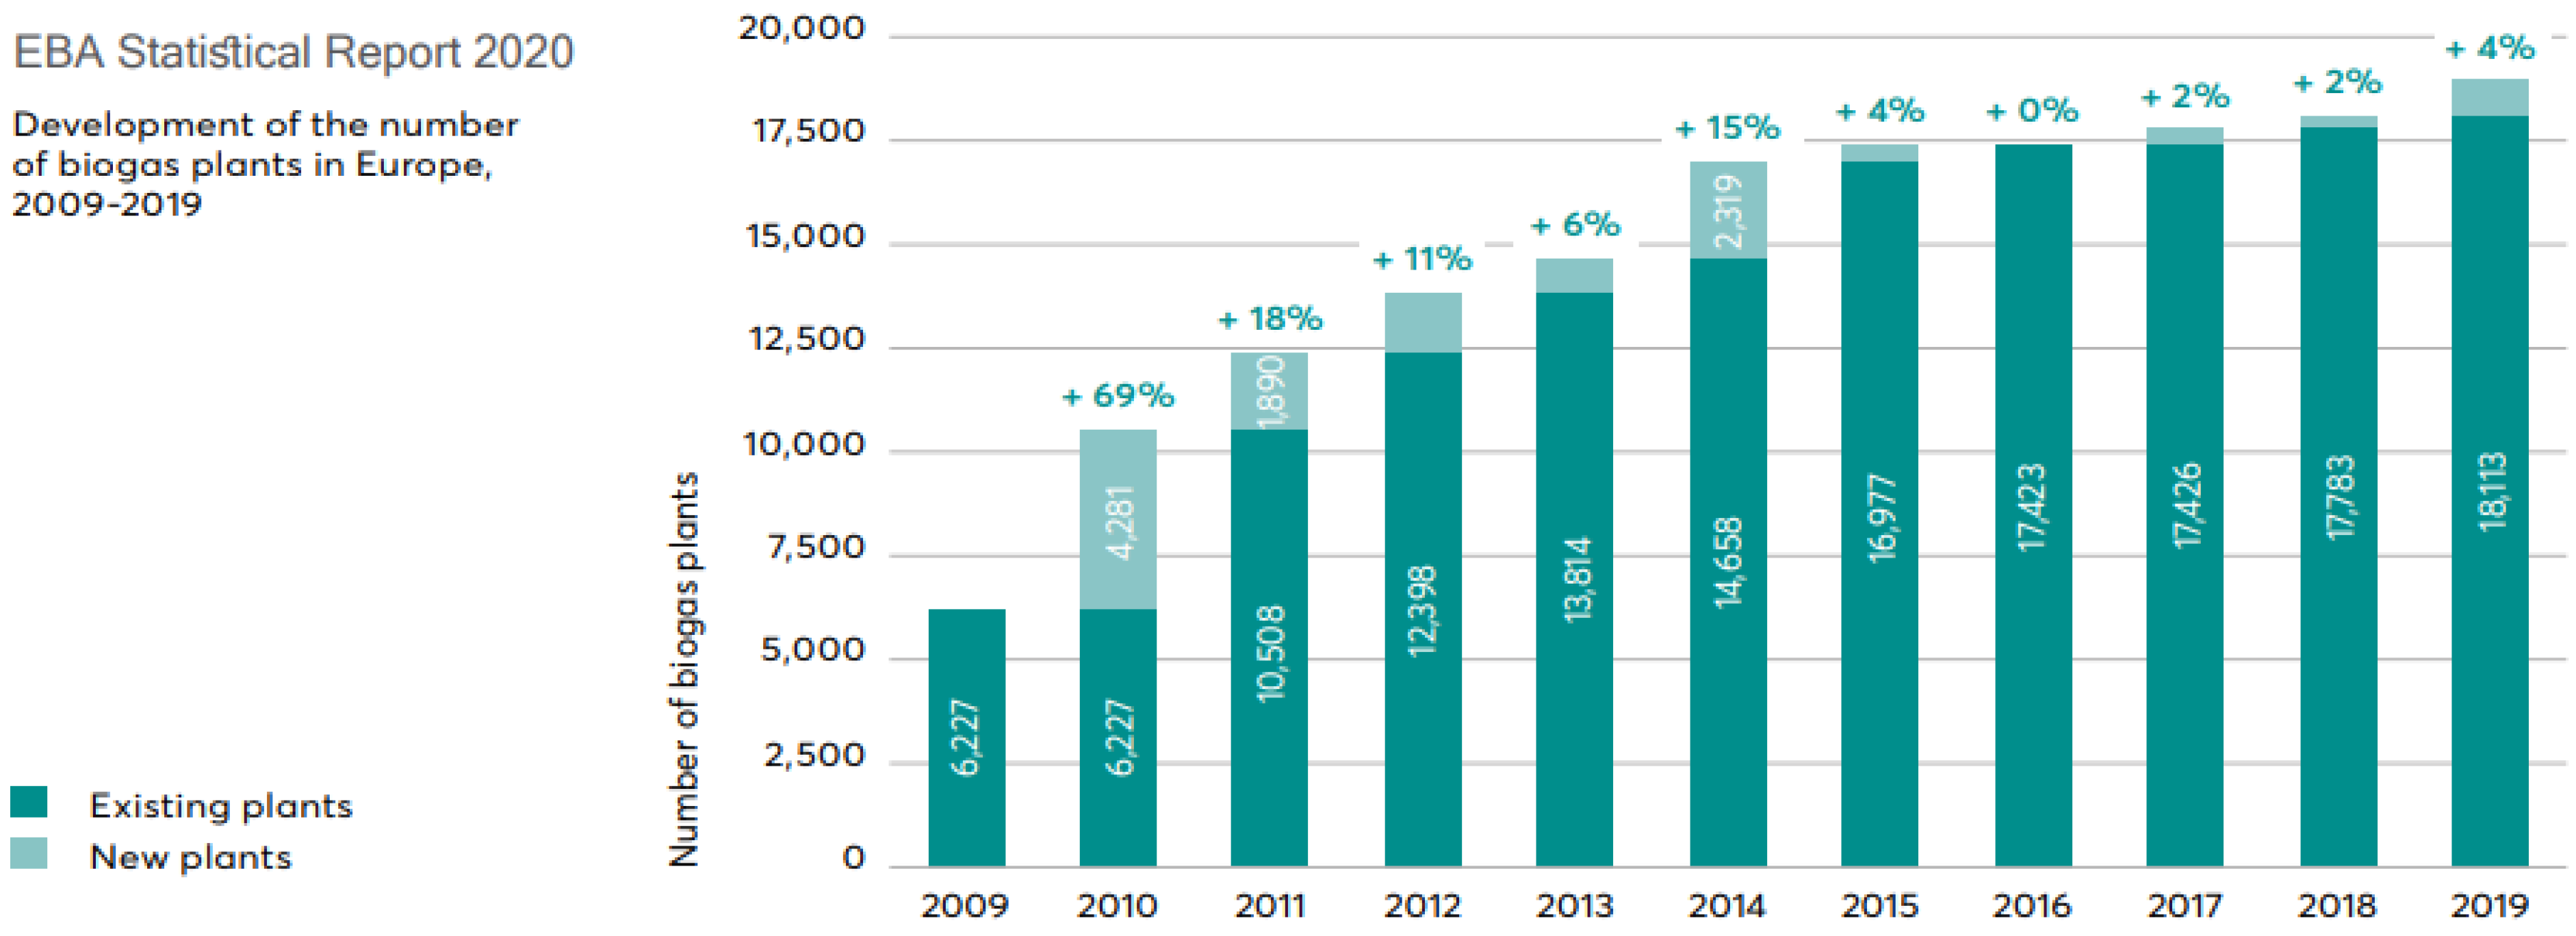
Despite revenue challenges, investment in Europe's biomethane infrastructure continued to grow through 2023. This growth was fueled by the long-term policy visibility provided by the EU's REPowerEU plan. The plan set a goal of producing 35 billion cubic meters (bcm) of biomethane annually in Europe by 2030, a significant increase from the roughly 3-4 bcm being produced at the time of publication.
How Natural Gas Price Volatility Affects Biomethane Markets
The gas price cycle of 2021–2023 dramatically altered the biomethane market's view of price risk. When TTF prices reached record highs in 2022, biomethane was competitive with traditional gas in nearly all European markets without the need for subsidy support.
This landmark event attracted significant interest from major energy companies, utilities, and infrastructure funds. The subsequent price correction in 2023 did not dampen this interest; instead, it hastened the move toward long-term contracted offtake structures that provide price certainty regardless of spot market fluctuations.
Biomethane's value proposition as a domestically produced, policy-supported renewable gas was so well established that capital continued to flow even as the short-term price environment became less favourable.
Price Variations in Key European Markets
Europe does not have a uniform price for biomethane. The market structure, regulatory framework, subsidy mechanisms, and grid access conditions create significant regional price differences that directly affect the returns on projects.
Germany, France, Italy, and the Netherlands each have unique support schemes, ranging from feed-in premiums to quota obligations. These schemes result in different effective prices for biomethane producers in each jurisdiction.
Scandinavian markets, especially Sweden and Denmark, have historically had higher certificate premiums due to strong demand for certified renewable gas in the transport sector under vehicle fuel mandates. Understanding these regional dynamics is not just an option for serious market participants. It is fundamental to accurate investment analysis.
Biomethane's Global Market: Size, Growth, and Key Figures
According to Fortune Business Insights, the global biomethane market was valued at USD 6.95 billion in 2025, and is expected to grow to USD 10.74 billion by 2034 at a compound annual growth rate of 4.97%. These figures reflect a market that has grown beyond the pilot project phase and has become a mainstream part of the energy infrastructure, attracting sovereign wealth funds, major utilities, and specialist renewable energy investors on a large scale.
Global biogas and biomethane production is currently receiving an annual investment of approximately USD 2 billion. However, according to the International Energy Agency, this figure is expected to increase to over USD 15 billion per year by 2050 under its Stated Policies Scenario (STEPS).
Under its Announced Pledges Scenario (APS), the figure could reach nearly USD 45 billion annually. This trend demonstrates how deeply biomethane is ingrained in long-term energy transition planning at the highest policy levels around the world.
Market Worth in 2025: $6.95 Billion and Rising
The worldwide biomethane market reached USD 6.95 billion in 2025, a number that represents over ten years of policy backing, technological advancement, and increasing business demand for certified renewable gas.
What's remarkable is not just the magnitude but the makeup: European markets make up the majority of that worth, with the US market emerging as the next significant growth area as Renewable Natural Gas (RNG) incentives under the Renewable Fuel Standard continue to stimulate domestic production investment.
Expected Increase to $10.74 Billion by 2034 at 4.97% CAGR
The 4.97% CAGR through 2034 is not an estimated guess — it is a growth rate supported by firm regulatory targets, a growing feedstock base, and infrastructure investment that is already committed. The path from USD 6.95 billion to USD 10.74 billion by 2034 represents a market adding approximately USD 420 million in value annually on average, driven by new production capacity coming online across Europe, North America, and increasingly Asia-Pacific. For investors, this is a market with a clear, policy-anchored growth runway — not a technology gamble.
Why Europe Has a 61.34% Share of the Global Market
Europe's market share of 61.34% (which will generate a revenue of USD 4.26 billion in 2025) is not a coincidence. It is the result of more than 15 years of regulatory framework development, including the EU Renewable Energy Directive, national biomethane support schemes in Germany, France, Italy, and Denmark, and the more recent REPowerEU biomethane action plan, which aims to produce 35 bcm annually by 2030. No other region has developed such a comprehensive policy support system.
The US is catching up quickly, but Europe's combination of grid infrastructure, regulatory certainty, and certificate market liquidity makes it the global benchmark for biomethane pricing and investment.
What Influences Biomethane Price Changes?
Biomethane prices don't just randomly fluctuate. They are influenced by a complex set of cost and demand factors — some are common with traditional energy markets, while others are unique to the renewable gas industry.
Recognising which factors are most significant in a particular market and timeframe is the primary analytical job for anyone developing a biomethane price perspective.
Feedstock Costs: Agricultural Waste versus Energy Crops
Feedstock is the most significant variable in the economics of biomethane production, and there is a substantial difference between the cheapest and most expensive types of feedstock. Waste-based feedstocks, including animal manure, municipal solid waste, food processing residues, and sewage sludge, can have negative effective costs when tipping fees are factored in, meaning the producer is paid to take the material. In contrast, energy crops must be purchased at market prices, and agricultural commodity inflation in 2022–2023 significantly increased these input costs.
The IEA estimates that 90% of the global potential for biomethane is in the USD 10–30/GJ production cost range, with the cheapest supplies, primarily in Asia and using agricultural waste feedstocks, available for less than USD 10/GJ. The choice of feedstock that a developer makes at the project design stage is essentially a long-term price risk decision that will shape the economics of the facility for its entire operating life.
Costs of Production Methods: Anaerobic Digestion vs. Gasification
Anaerobic digestion (AD) is currently the leading method for producing biomethane globally. It uses biological processes to break down organic matter into biogas, which is then upgraded. AD is a well-established, well-understood technology with known cost curves. On the other hand, gasification — which thermochemically converts solid biomass into syngas before methanation — is less commercially mature but can process a wider range of feedstocks.
This includes woody biomass and agricultural residues that AD can't efficiently handle. Biomethane produced via gasification currently has higher production costs than AD. However, the technology gap is closing as demonstration projects scale up to commercial operation. The choice of production method directly impacts capital expenditure, operating costs, and — importantly — the feedstock flexibility that determines long-term price competitiveness.
Regulatory Frameworks, Subsidies, and Government Policy
More than other energy sectors, policy is the most influential price factor in the biomethane market. This is because, in most markets, without support mechanisms, biomethane production is not yet cost-competitive with fossil gas on a large scale.
Quota obligations, feed-in premiums, carbon pricing, and blending mandates all directly impact the revenue a biomethane producer can capture, thus affecting the price at which projects become financeable.
The RED III directive of the EU, which became effective in 2023, has substantially reinforced renewable gas mandates for transport and industry — creating binding demand for certified biomethane that supports certificate prices independently of the wholesale gas market.
The reformed Renewable Energy Sources Act (EEG) of Germany and the biomethane injection tariff of France have been particularly crucial in driving European project development at scale.
In the US, the Renewable Fuel Standard (RFS) and the California Low Carbon Fuel Standard (LCFS) continue to generate Renewable Identification Number (RIN) and LCFS credit revenues that can exceed the commodity gas value of the biomethane itself in some project configurations.
Increased Demand in Automotive and Power Generation
The demand for biomethane in the transport sector, especially as compressed biomethane (CBM) and liquefied biomethane (LBM) for heavy-duty vehicles, has become a structurally significant driver of demand, particularly in markets with vehicle fuel mandates and fleet decarbonization targets.
In Europe, the growing network of compressed natural gas (CNG) and liquefied natural gas (LNG) fueling infrastructure is increasingly being supplied with certified biomethane, commanding premium prices over grid-injected volumes.
Power generation demand, while less dominant in the biomethane price story than transport, provides an additional offtake channel — particularly for smaller-scale projects where grid injection is not technically or commercially viable.
What to Expect for Biomethane Prices from 2026 to 2034
As we look towards 2026 to 2034, the price forecast for biomethane is influenced by three main factors:
- the trend of wholesale gas prices in Europe (which establishes the minimum price for biomethane molecules),
- the development of certificate markets as more certified volume enters the market and regulatory demand signals become stronger, and
- the speed at which production costs decrease as the technology scales up and the supply chains for feedstock become more mature.
For those interested in understanding the infrastructure behind this, a biogas plant construction guide offers valuable insights.
According to a study by the IEA, there is a potential for approximately 45 bcme of biomethane production worldwide that could be utilised at a cost that is the same or less than the current wholesale prices for natural gas. This is already more than five times the current global production of biomethane.
As this potential is gradually tapped into, the marginal cost of new biomethane supply will increasingly influence price levels, transitioning the market from a product that is primarily supported by policy and sold at a premium to a more cost-driven commodity.
However, it will still maintain a premium for certificates as long as the demand for certified renewable gas exceeds the supply.
Most forecasters are keeping a close eye on the rate of capacity addition compared to policy-driven demand growth. If the REPowerEU 35 bcm by 2030 target causes demand to rise faster than new production can be brought online, certificate prices could stay high through the late 2020s.
If capacity additions speed up, supported by the IEA's projected significant annual investment increase, the molecule premium over fossil gas could shrink while certificate values stabilise at a lower equilibrium.
Each scenario has significantly different implications for project returns, which is why scenario-based forecasting is the go-to analytical method for serious market participants. For those exploring alternatives to natural gas, understanding these dynamics is crucial.
- Molecule prices are likely to follow TTF with a renewable premium, with the size of that premium being sensitive to the speed of recovery of the European gas market and geopolitical developments affecting LNG import dependency
- GoO and RGGO certificate prices are projected to remain supported through 2028 as corporate sustainability demand and compliance obligations grow faster than certified supply
- Waste-based biomethane will continue to command a certificate premium over crop-based production under EU sustainability rules, widening the spread between feedstock categories
- Production cost deflation is expected as technology scales, with anaerobic digestion costs declining incrementally and gasification-based pathways becoming increasingly cost-competitive toward 2030
- Long-term BPA structures with price indexation mechanisms will become the dominant commercial framework, insulating both producers and offtakers from spot market volatility.
 This was the outlook when we last published about the biomethane price in 2022.
Short-Term Price Outlook: 2026–2028
The 2026–2028 window is likely to be characterised by continued strong certificate market dynamics and a moderate recovery in European wholesale gas prices:
- from the post-crisis lows of 2023–2024
- from the effects of shortages due to the closure of the Straits of Hormuz.
Biomethane producers with waste-based feedstocks and long-term offtake agreements in place are positioned to generate stable, above-market returns during this period. New entrants commissioning projects in 2026–2027 will face a more competitive landscape than projects developed during the subsidy-heavy early phase of the market, requiring sharper project economics and more sophisticated commercial structuring to achieve bankable returns.
Until 2028, the US market is predicted to be a lucrative prospect, with RIN and LCFS credit incomes supporting strong project economics for dairy digester and landfill gas-to-biomethane projects. This is especially true in California, where the LCFS credit price has traditionally produced revenues significantly higher than the commodity gas value of the output.
Projected Price Trends Until 2034
By 2034, the worldwide biomethane market is estimated to be worth USD 10.74 billion. However, the internal makeup of this value will be quite different from what it is today. Certificate markets will be more fluid and more effective, with pricing discovery mechanisms that more accurately represent the actual sustainability value of different production methods. For top-tier projects, production costs will have decreased significantly, and the market will have more clearly split between premium waste-based biomethane and lower-cost, lower-premium crop and residue-based production. The facilities that will yield the highest long-term returns are those that are being planned today with this future market structure in mind. These projects prioritize feedstock sustainability, certificate eligibility, and offtake flexibility rather than simply pursuing the highest short-term gate price.
The International Energy Agency (IEA) has estimated that the global biomethane industry will attract over $15 billion in annual investments by 2050, under the STEPS scenario. This is a significant leap from where the industry stands today. The projects that will be commissioned between now and 2034 will form the backbone of this expanded infrastructure. This makes the current period one of the most critical times for investment decisions in the history of the biomethane sector.
How Biomethane Purchase Agreements (BPAs) Offer Price Stability
A Biomethane Purchase Agreement is a long-term agreement between a biomethane producer and a buyer — usually a utility, industrial buyer, or energy retailer — that sets the commercial conditions for gas delivery over a specified period, typically 10 to 20 years. In a market where spot prices can fluctuate significantly with TTF movements and certificate market dynamics, a well-structured BPA is the most effective tool a developer has for establishing bankable, predictable income — which is what makes project financing possible at competitive conditions.
It's critical to understand the structure of a Biomethane Purchase Agreement (BPA). The most advanced agreements divide the price of the molecule from the price of the certificate, each with its own indexation method. The molecule portion is usually indexed to a wholesale gas benchmark like the Title Transfer Facility (TTF) with a fixed premium, while the Guarantee of Origin (GoO) or Renewable Gas Guarantee of Origin (RGGO) certificate component may be fixed, inflated, or linked to a regulatory price signal. This separation benefits producers when wholesale gas prices drop — certificate revenues can help offset molecule price compression — while providing offtakers with the sustainability verification they need to meet their own compliance and Environmental, Social, and Governance (ESG) reporting requirements.
European BPAs signed after 2022 are increasingly featuring price floors and collars. These mechanisms establish a minimum price that the producer will receive, no matter how much the spot market prices plummet. In return, the producer's upside is capped if prices skyrocket above a set ceiling. For lenders financing biomethane projects, price floors in BPAs are often a requirement for debt financing. They turn an asset with commodity price exposure into something that resembles a regulated infrastructure asset from a risk standpoint.
As the market has grown, the length of BPAs has also increased. Initial European biomethane agreements were often five to seven years long, reflecting buyer hesitation about a new asset class. Today, 15-year and 20-year BPAs are routinely signed for waste-based biomethane projects with strong sustainability credentials, reflecting how institutional buyers — especially those with net-zero commitments requiring verified renewable gas supply — view long-term biomethane procurement as a strategic priority rather than a commodity trading decision.
BPA Structure: Key Components to Evaluate
BPA Component What to Look For Why It Matters Molecule price indexation TTF linkage with fixed premium or floor Protects revenue when wholesale gas prices fall Certificate pricing Separate GoO/RGGO price with escalation Captures full value of renewable credential Price floor / collar Minimum guaranteed price per MWh Required by lenders; reduces financing risk Contract duration 10–20 years for waste-based projects Matches asset life; supports long-term debt Volume commitment Take-or-pay or best-efforts structure Determines revenue certainty for debt service PoS documentation Feedstock-specific sustainability verification Enables compliance use by offtaker under RED III
What These Trends Mean for Biomethane Investors Right Now
The convergence of maturing certificate markets, tightening EU renewable mandates, and a growing pipeline of institutional-grade BPA structures has created a biomethane investment environment that is simultaneously more competitive and more legible than it was three years ago. The era of capturing outsized returns simply by being early is largely over in core European markets. What replaces it is a discipline-driven investment landscape where returns are determined by the quality of commercial structuring, feedstock strategy, and price forecast accuracy — not by market novelty.
Top Markets to Keep an Eye on in Europe
Germany, France, Italy, and Denmark are the four largest biomethane markets in Europe, each with unique risk-return profiles influenced by their national support mechanisms. Germany's feed-in premium system offers robust revenue floor protection for eligible projects. France's biomethane injection tariff system has fueled significant capacity growth, although tariff levels for new projects are periodically reviewed. Italy's incentive framework has attracted a lot of foreign investment, especially from UK and Dutch infrastructure funds. Denmark, one of the first countries to move into biomethane, offers a mature, liquid market with strong demand from the transportation sector and well-developed grid injection infrastructure. Besides these four, the Netherlands, Sweden, and Spain are the markets that are seeing the most deal activity among new players, each offering increasing regulatory support and improving grid access conditions.
How to Use Price Forecasts in Due Diligence and Financing Decisions
Independent, scenario-based price forecasts — covering molecule prices, GoO/RGGO certificate values, and PoS premiums across multiple markets and production types — are now a standard component of biomethane project due diligence. Lenders, equity investors, and offtakers each apply these forecasts differently, but the underlying requirement is the same: a credible, third-party validated view of what biomethane will be worth over the project's operating life, under multiple market scenarios. Using a single base-case price assumption without stress-testing against downside scenarios is a financing risk that sophisticated lenders will identify and push back on.
When building price forecasts into a financial model, it is critical to distinguish between contracted and uncontracted revenue. Contracted revenue, which is secured through BPAs with creditworthy counterparties, should be modeled separately from merchant exposure. Different discount rates should be used to reflect the different risk profiles. The proportion of revenue that is contracted versus merchant often determines whether a project receives investment-grade financing terms. A project that has 80% of its 10-year revenue contracted under a BPA with a price floor will be able to access significantly cheaper debt than a project that sells 100% of its output at spot.
Staying Informed in the Biomethane Market is Essential for Success
Investing in biomethane isn't as simple as just setting it and forgetting it. The rapid changes in prices, policy frameworks, and certificate market dynamics mean that the assumptions that were valid for a project that was developed in 2021 may not be the same for a project being financed today. These assumptions will likely change again for a facility that will be commissioned in 2027. The investors and developers who are seeing the most success in this market are those who are continuously staying informed about price intelligence, rather than just using it as a one-time underwriting exercise. The data is out there. The analytical frameworks are there. The market rewards those who make the most of these resources.
Common Questions
There's a lot of curiosity about the biomethane market, especially among newcomers like investors and developers. It's a complex market with a lot of variables, like pricing, certificates, and regional regulations, which can make it seem hard to understand if you're not familiar with it. The questions below are designed to clear up some of the most common misconceptions and provide straightforward, useful answers based on the realities of the market.
The responses provided here are based on the European biomethane market's conditions between 2023 and 2025, taking into account global trends where applicable. Specific price figures and market conditions may change due to policy changes and movements in the wholesale gas market, so these should be viewed as guidelines for understanding rather than fixed figures.
What is the current price of biomethane per MWh in Europe?
There isn't a single exchange that publishes biomethane prices in Europe, which makes it harder to determine the price at a specific point in time compared to electricity or natural gas. Generally, the prices of biomethane molecules in Europe trade at a premium to the TTF wholesale gas benchmark, with the premium size varying by market, feedstock type, and offtake structure.
The all-in effective price a producer captures is produced by adding GoO or RGGO certificate values on top of the molecule price, which for waste-based biomethane can be substantial.
Production costs for most European projects are in the €60–€120/MWh range, and projects need effective all-in pricing above their production cost to be commercially viable. Independent price forecasting services that track both molecule and certificate components across specific European markets provide the most accurate current pricing reference for serious market participants.
What differentiates the price of biomethane from the price of natural gas?
The price of biomethane differs from the price of natural gas because it includes a renewable premium in addition to the value of the commodity molecule. Even though both fuels are molecularly identical and can use the same grid infrastructure, biomethane comes with
Guarantees of Origin and Proof of Sustainability documentation that natural gas does not have. Buyers who have decarbonization obligations — under EU RED III, corporate net-zero commitments, or transport fuel mandates — pay a premium for this certification. Consequently, the effective market price of biomethane is the sum of the wholesale gas benchmark and the certificate premium, which makes it structurally higher than conventional natural gas under most market conditions.
What causes biomethane prices to change?
There are many factors that cause biomethane prices to change, which makes it more difficult to predict than traditional energy prices. The molecule component is tied to European wholesale gas benchmarks, primarily TTF, which means that events like geopolitical shifts, disruptions in LNG supply, spikes in demand due to weather, and storage level reports can all indirectly affect the price of biomethane molecules.
The certificate component is affected by different factors, including regulatory demand (how many MWh of certified biomethane are required by law), certified supply (how many GoO-backed volumes are available), and demand from industrial buyers who need verified renewable gas to comply with ESG.
Thirdly, feedstock costs, which impact the cost of production, can also cause fluctuations. For production based on energy crops, the cycles of agricultural commodity prices can greatly shift the economics of a project within just one year.
For projects based on waste, the relevant variables are tipping fee rates and the terms of municipal contracts. Changes in costs related to technology, such as improvements in upgrading efficiency or reductions in electrolyser costs for power-to-gas applications, lead to longer-term trends of cost deflation that affect the competitive dynamics of new supply entering the market.
Policy is arguably the most influential factor in the medium term. A change in national feed-in tariff levels, an update to EU RED sustainability criteria that affects feedstock eligibility, or a new blending mandate in the transport sector can shift the effective price of biomethane across an entire regional market almost immediately. It is essential for anyone actively monitoring biomethane price trends to not only keep an eye on the current rules but also on proposed amendments. This is a core requirement.
- Wholesale gas prices (TTF and regional benchmarks) — drive the molecule component
- GoO/RGGO certificate market supply and demand — drive the renewable premium
- EU RED III and national regulatory frameworks — create mandatory demand signals for certified volumes
- Feedstock cost cycles — affect production economics differently by feedstock type
- Geopolitical events — affect European energy security and biomethane's strategic value
- Corporate sustainability demand — creates additional certificate demand beyond compliance requirements
- Technology cost trends — shape the long-term competitive cost of new biomethane supply
Is biomethane a good long-term investment given current price forecasts?
Based on current market data and the IEA's investment projections — with annual global investment in biogas and biomethane production rising from around USD 2 billion today to over USD 15 billion by 2050 under the Stated Policies Scenario — the fundamentals for long-term biomethane investment remain compelling.
The market has a clear policy-anchored growth trajectory, a diversified revenue structure that combines molecule value with certificate premiums, and a feedstock base that in many cases generates negative input costs.
The most important qualification is that returns are not uniform — they are heavily dependent on feedstock strategy, offtake structure, market selection, and the quality of price assumptions used in project modelling.
Well-structured waste-based projects in markets with strong regulatory support have generated consistent, infrastructure-grade returns. Poorly structured projects in markets with policy uncertainty have not. The asset class rewards discipline, not just exposure.
Sources:
- Article: “Biomethane is the cheapest and easiest to scale form of renewable gas available today” https://gasforclimate2050.eu/biomethane/